Bryan C. Johns

Clear data. Clear decisions.

Fluent in Data. Fluent in Human.

A generalist at heart, I use data as a language for our oldest pursuit—understanding how the world works, how things connect, and what they mean. I help people understand the world so they can take better care of it.

Data is a way of seeing clearly. I make it usable, readable, and human.

Work with me on mission-driven projects. I'm available for full-time and contract opportunities in data analysis, research, and visualization.

Built with Python, R, SQL, and JavaScript. Explore featured projects below, or visit the About page to learn more.

Featured Projects
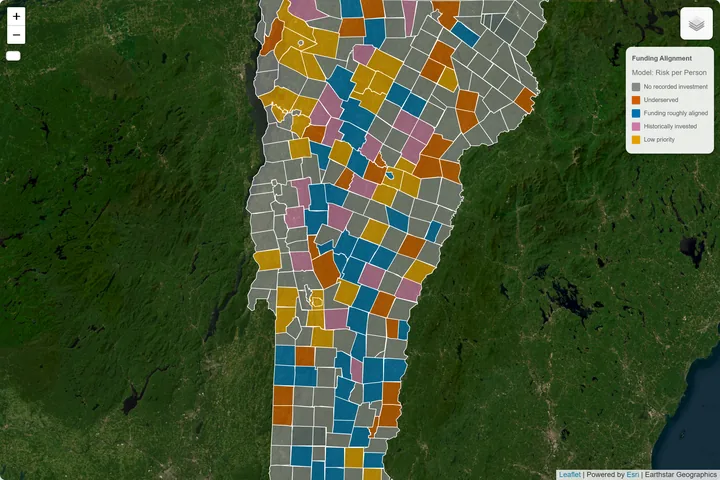
Quadrant choropleth map categorizing Vermont towns by relative flood risk and FEMA disaster funding per capita

Floodlines

How Flood Risk Becomes Public Investment


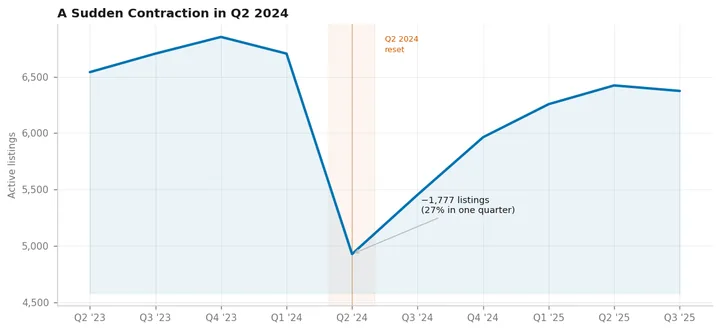
Line chart showing Washington DC Airbnb listing counts dropping by roughly 1,800 following 2019 Short-Term Rental Act enforcement

Capital Crashpad

When 1,800 Listings Vanished


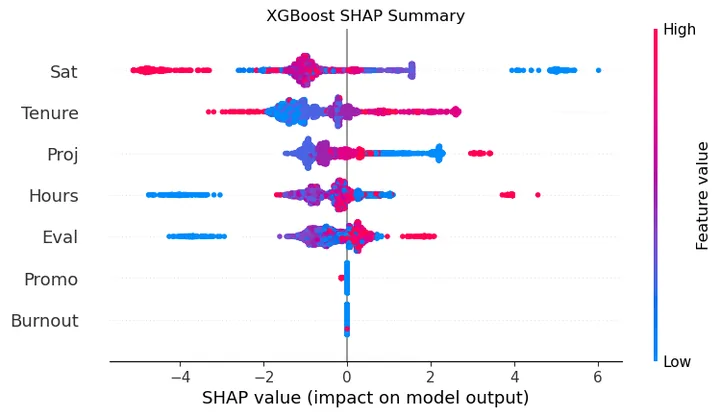
SHAP value plot showing which employee features most influence turnover predictions in the XGBoost model

Classified: At-Risk

A Machine Learning Model for Employee Turnover


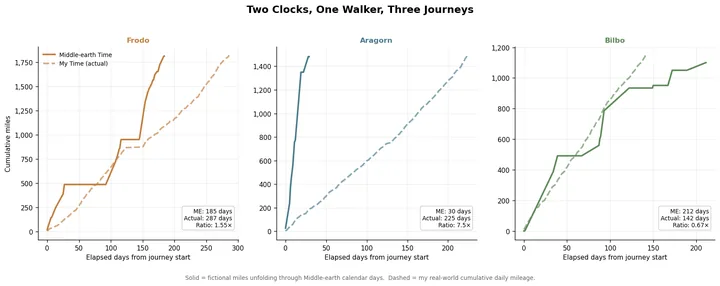
Dual-clock chart comparing cumulative real walking miles to fictional Lord of the Rings journey distances across three years

Walk to Mordor

Real footsteps. Fictional journeys.


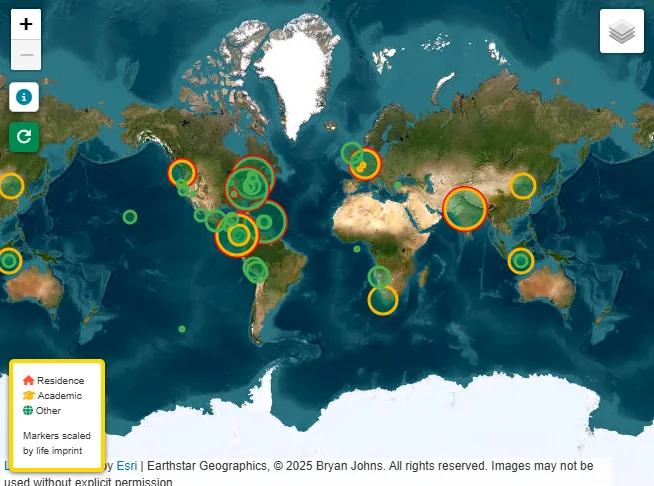
Interactive Leaflet map showing travel waypoints, routes, and photo markers across multiple continents

Waypoints

A Technical Memoir in Maps and Data Layers