Short-term rentals reshape housing markets, neighborhoods, and regulation. Capital Crashpad's dashboard and case study chart the sharp drop in Washington, DC Airbnbs after a nationwide rollout of identity checks and quality removals, showing how platform governance can shift local markets beyond city law.
Project Links
This project is, quite literally, close to home for me; I live in DC. I stumbled on a sharp drop in Airbnb listings while digging through the data, and it caught my attention. Some internet sleuthing revealed it coincided with changes in company policy, not local laws. Routine EDA turned into a deeper investigation: the data showed a structural break, with lucrative extended-stay rentals disappearing. I built this tool for anyone in DC to explore these shifts, whether you’re curious about your block or the big picture.
Project Overview
The guiding question was not how many Airbnbs exist, but how platform policies reshaped the structure of supply.
Using quarterly listing data stored in PostgreSQL and analyzed in Python, I built a full pipeline to track changes in pricing, licensing status, minimum-night distributions, and projected revenue before and after enforcement. The dashboard integrates Leaflet and JavaScript to visualize neighborhood patterns and regulatory thresholds, while the written case study interprets those shifts in plain language.
The result is both a tool and an argument. The dashboard enables exploration; the case study explains what changed and why it matters. Together, they show how platform governance can alter local housing markets almost overnight.
Technically, the project demonstrates database design, SQL querying, Python-based analysis, and geospatial visualization. More importantly, it reflects my focus as a data communicator: translating structural market changes into insights that policymakers and residents can actually understand and use.
Gallery
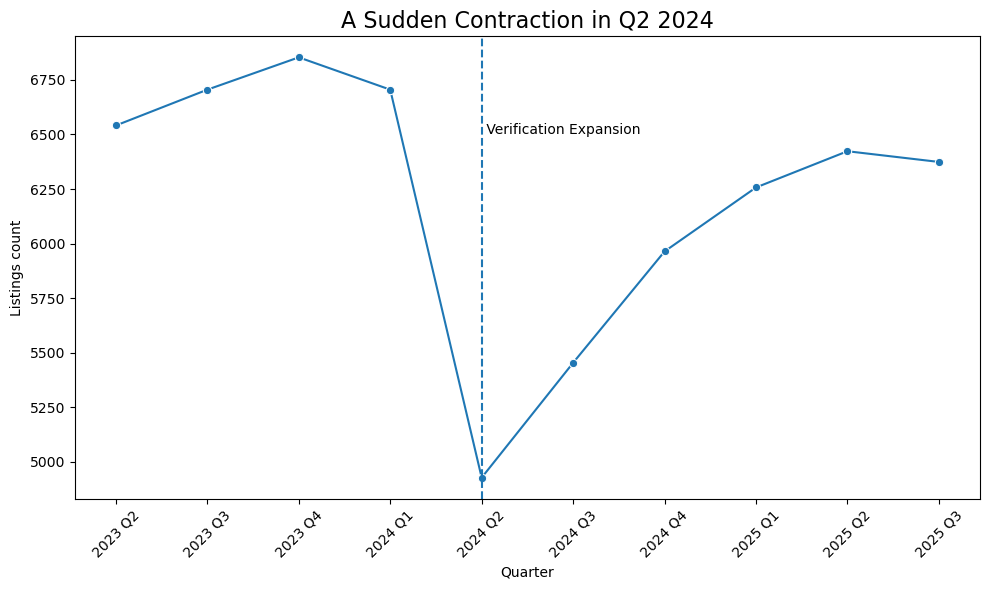 Listings Over Time (2023–2025): Active listings fall sharply
between Q1 and Q2 2024, marking a structural break coinciding with
Airbnb’s expanded verification and quality removals.
Listings Over Time (2023–2025): Active listings fall sharply
between Q1 and Q2 2024, marking a structural break coinciding with
Airbnb’s expanded verification and quality removals.
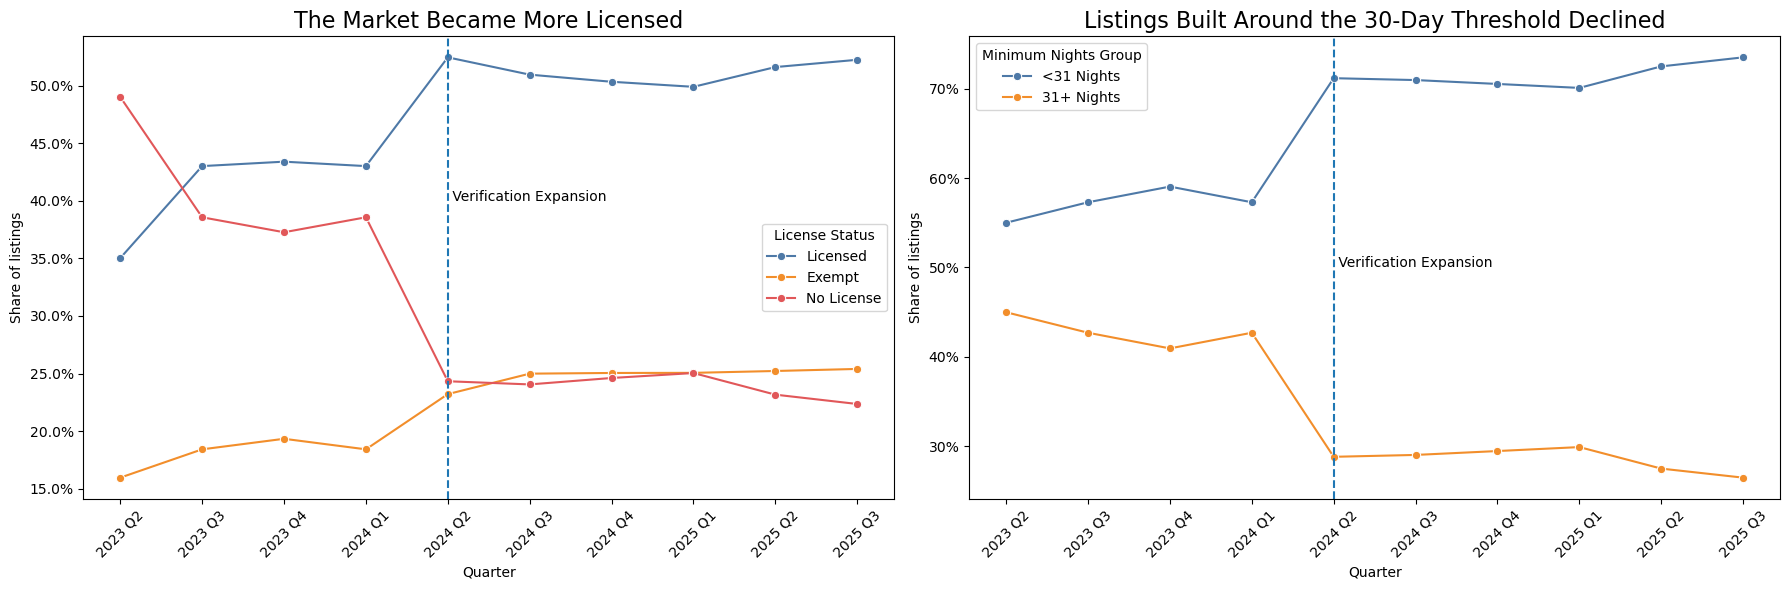 Licensing Share: Following the Q2 2024 contraction, the share of
licensed listings rises as unlicensed supply exits the
platform.
Licensing Share: Following the Q2 2024 contraction, the share of
licensed listings rises as unlicensed supply exits the
platform.
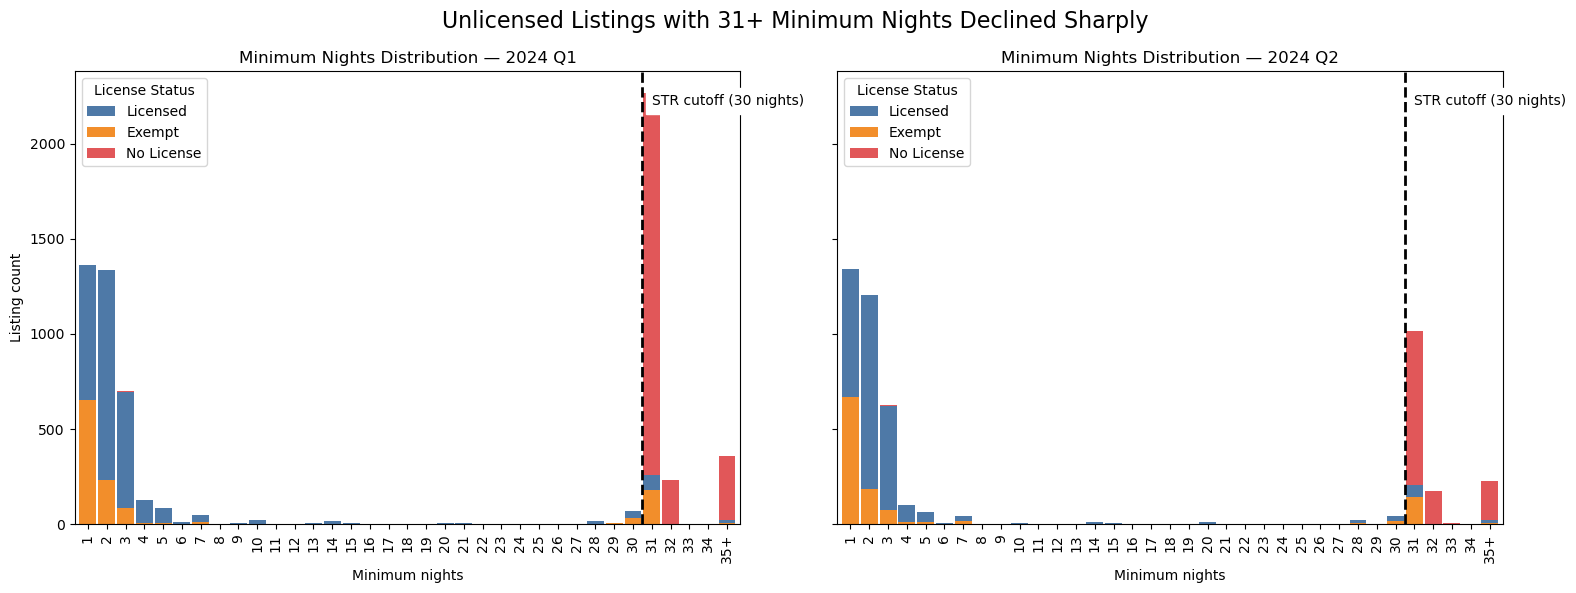 Minimum Nights (Pre vs Post): Unlicensed extended-stay (31+
night) listings decline disproportionately, accounting for a large
share of the overall market drop.
Minimum Nights (Pre vs Post): Unlicensed extended-stay (31+
night) listings decline disproportionately, accounting for a large
share of the overall market drop.
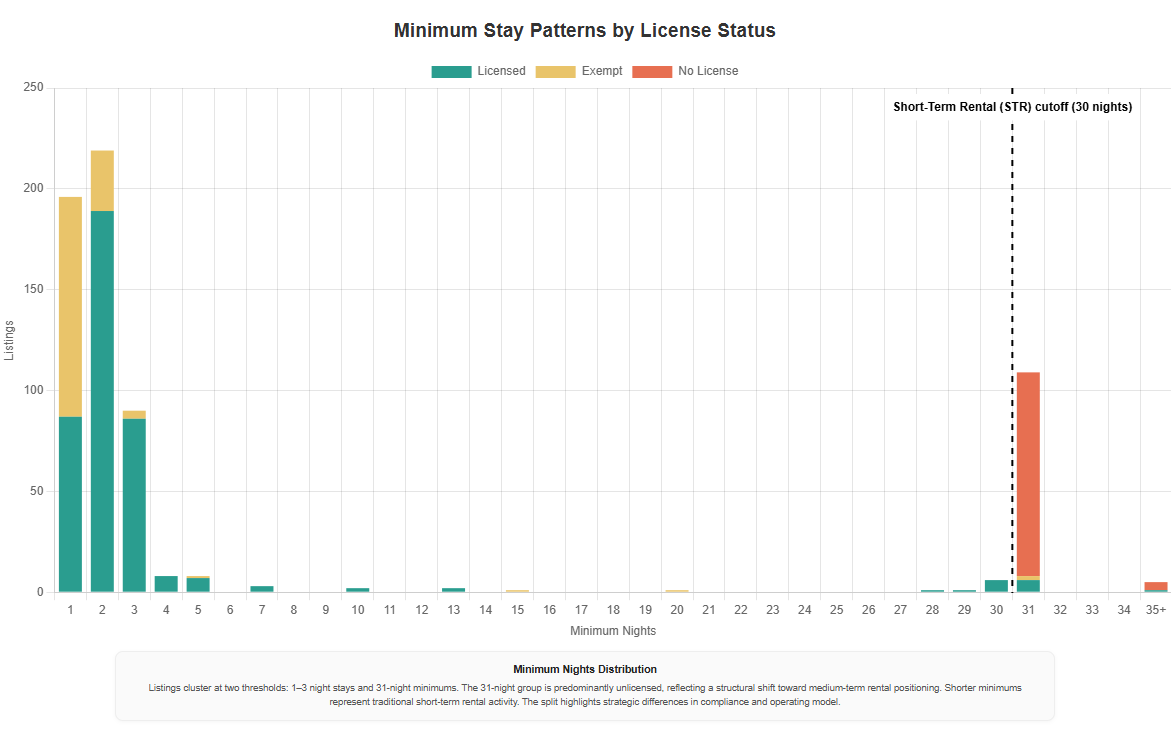 Minimum Nights (Dashboard View): Post-enforcement distribution
shows a reduced extended-stay segment and a higher proportion of
licensed listings.
Minimum Nights (Dashboard View): Post-enforcement distribution
shows a reduced extended-stay segment and a higher proportion of
licensed listings.
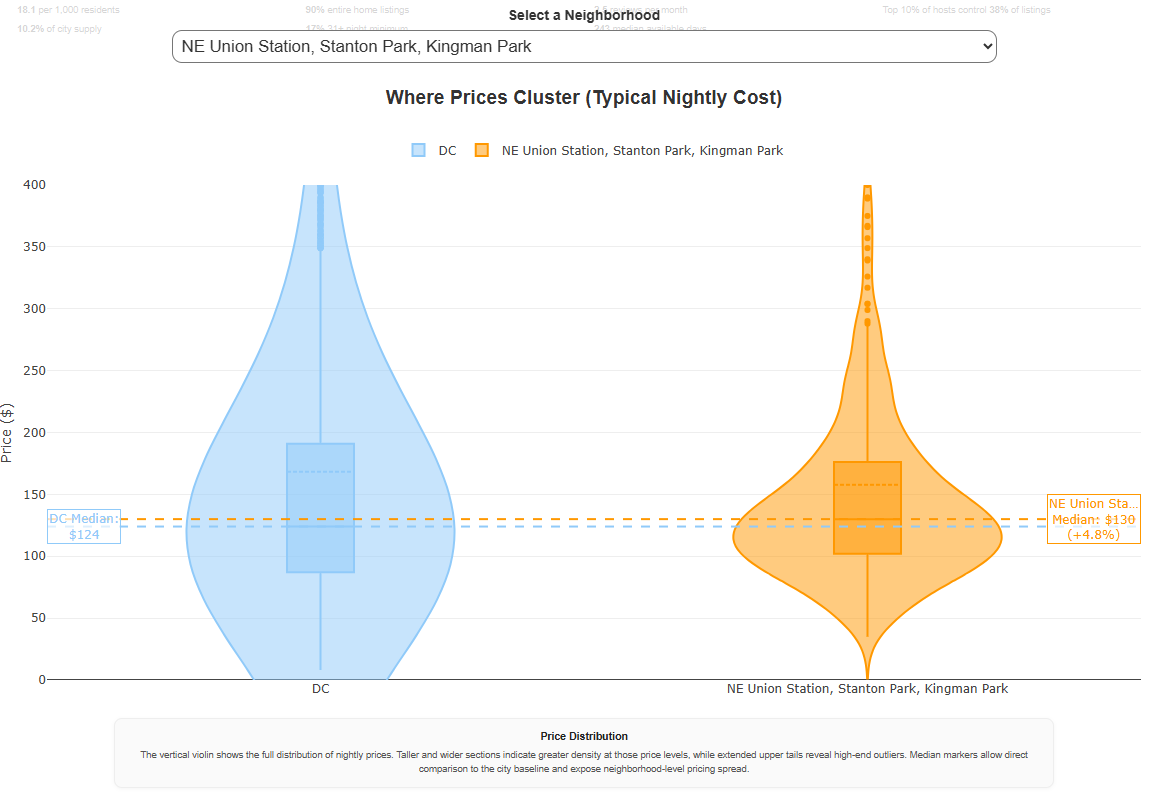 Price Distribution: Nightly prices remain widely dispersed after
enforcement, with median levels relatively stable despite reduced
supply.
Price Distribution: Nightly prices remain widely dispersed after
enforcement, with median levels relatively stable despite reduced
supply.
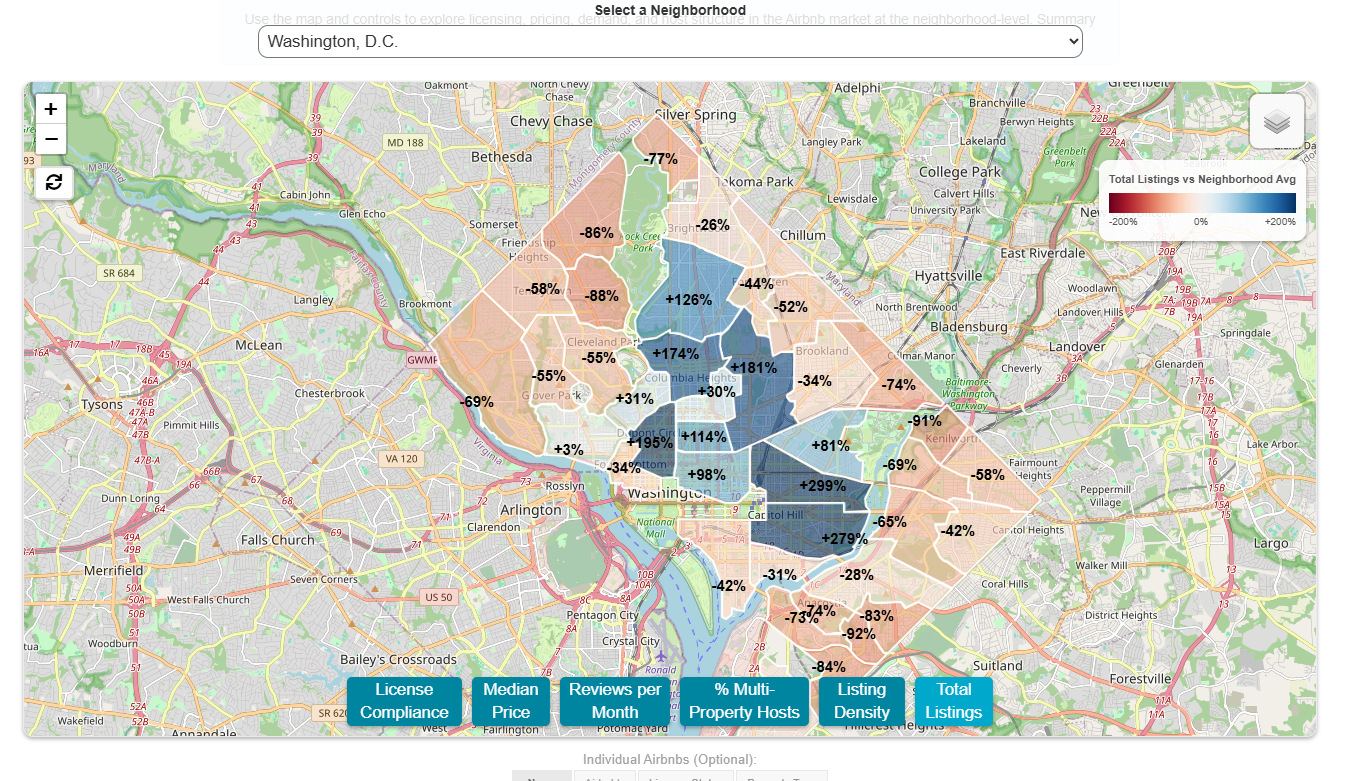 Listings by Neighborhood: Supply remains concentrated in central
DC, though listing density varies significantly across
neighborhoods.
Listings by Neighborhood: Supply remains concentrated in central
DC, though listing density varies significantly across
neighborhoods.
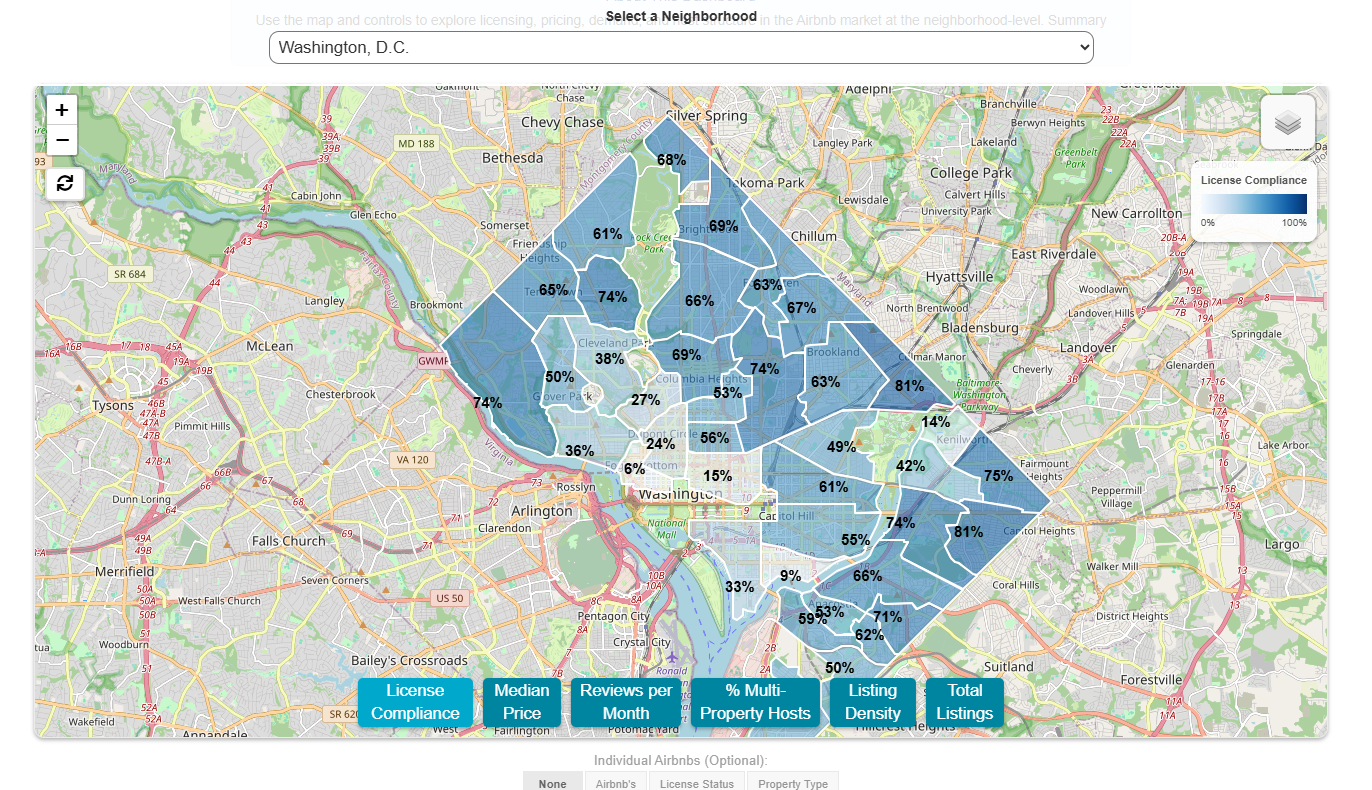 License Compliance by Neighborhood: Licensing rates vary
geographically, as uneven compliance patterns continue across the
city despite the increased proportion of licensed listings.
License Compliance by Neighborhood: Licensing rates vary
geographically, as uneven compliance patterns continue across the
city despite the increased proportion of licensed listings.
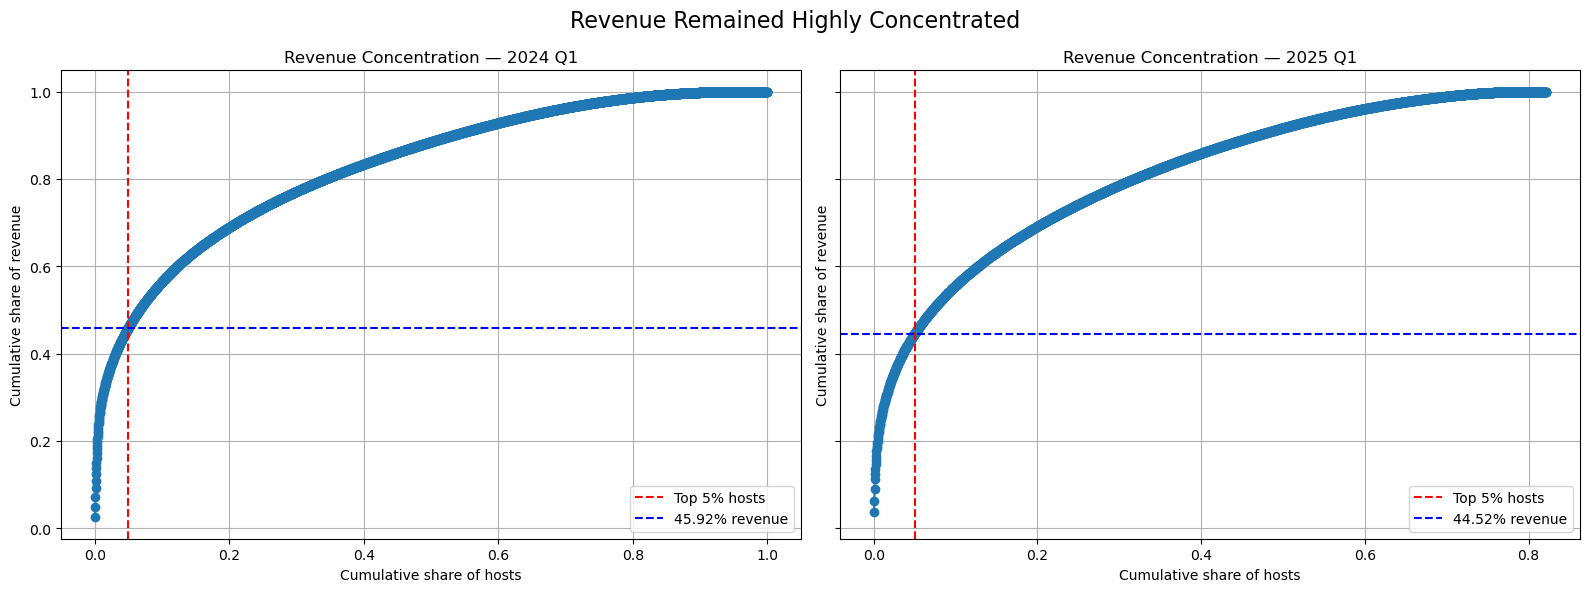 Revenue Concentration: Host revenue remains highly concentrated
before and after enforcement, indicating persistent structural
inequality within the market.
Revenue Concentration: Host revenue remains highly concentrated
before and after enforcement, indicating persistent structural
inequality within the market.
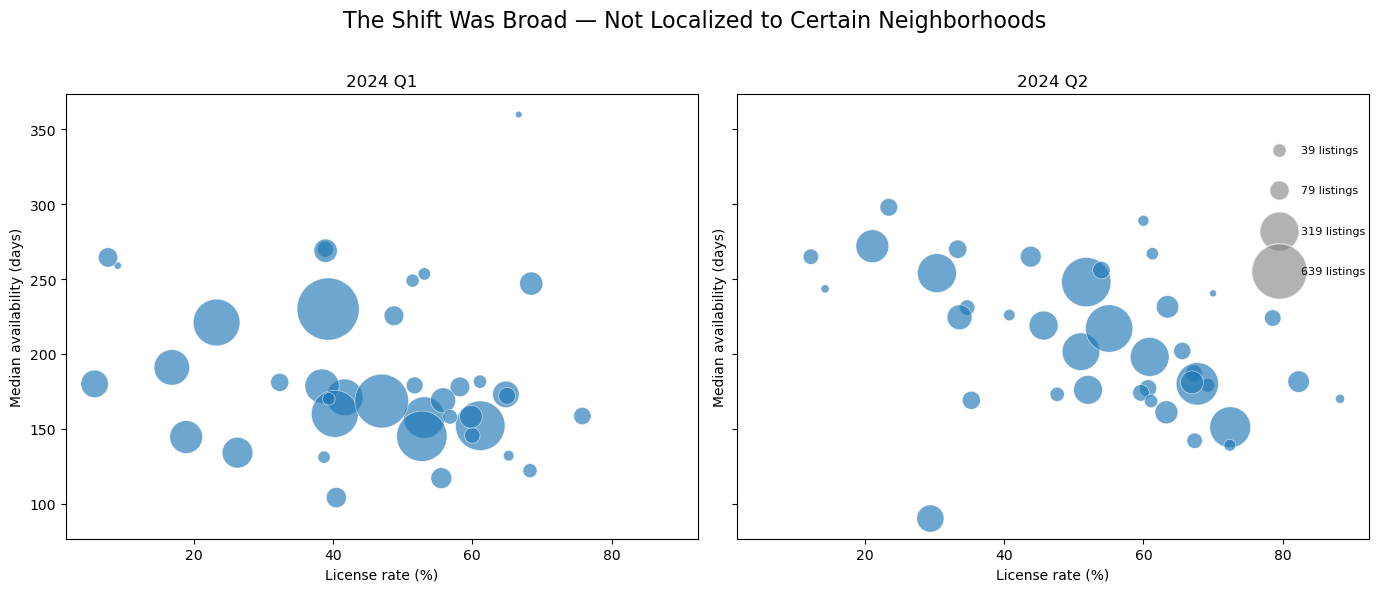 Neighborhood Stability: Licensing rates and listing availability
move together across many neighborhoods, illustrating broad
platform-level effects rather than isolated geographic
shifts.
Neighborhood Stability: Licensing rates and listing availability
move together across many neighborhoods, illustrating broad
platform-level effects rather than isolated geographic
shifts.
References
Dataset sourced from the Inside Airbnb Project. Additional data on neighborhood population and housing units came from Census Reporter.