Floodlines is an independent analysis of flood risk, social vulnerability, and FEMA mitigation funding across Vermont’s 250+ towns. Combining GIS, Census demographics, and federal disaster datasets, the project investigates whether mitigation dollars are reaching the communities that need them most.
Project Links
I grew up in Vermont, where rivers occasionally jumped their banks during a January thaw. After Irene in 2011, there was a sense that the state had survived an extraordinary disaster together — “Vermont Strong”. When the floods returned in 2023, that feeling curdled into something more sober: no once-a-century disaster, just a recurring condition. Floodlines grew out of that emotional shift. It gave me an opportunity to combine interests in maps, environmental systems, public policy, and data storytelling while exploring a question that will only become more urgent as climate risks intensify: how do institutions decide what gets protected, and who gets left waiting?
Project Overview
After Tropical Storm Irene and Vermont’s historic 2023 floods, it became increasingly difficult to view flooding as a rare disaster rather than a structural reality. At the same time, debates over floodplain remapping, climate adaptation, and disaster recovery raised broader questions about how mitigation funding is distributed, and whether existing programs are capable of reaching communities facing future risk before major losses occur.
To explore that question, I built a reproducible geospatial analysis pipeline combining FEMA flood-risk datasets, Census demographics, mitigation funding records, and spatial analysis techniques. The resulting interactive data story allows users to explore and compare flood exposure, social vulnerability, mitigation investment, and funding gaps across every Vermont municipality.
Across multiple models and sensitivity tests, the findings were remarkably consistent: mitigation funding showed only weak alignment with forward-looking measures of risk and vulnerability, while past flood insurance claims were a substantially stronger predictor of investment. That pattern is partly structural; the largest federal mitigation programs are closely tied to disaster declarations and prior loss history. More than half of Vermont municipalities received no FEMA Hazard Mitigation Assistance funding at all.
From a technical perspective, the project demonstrates geospatial ETL workflows, spatial statistics, composite index construction, sensitivity analysis, and interactive dashboard development with Leaflet and D3. More importantly, it reflects the kind of work I most enjoy: using data, maps, and public-facing storytelling to make complex systems easier to understand and interrogate.
Data Storytelling
Floodlines includes a guided, interactive data-storytelling tour designed to help users understand the analysis progressively rather than simply explore the dashboard independently. The tour uses contextual narration and guided interaction to move from the central research question through the risk, vulnerability, funding, and claims layers, helping users understand not only what the dashboard shows, but why the measures and comparisons matter.
Tools & Technologies:
-
Python • Pandas • GeoPandas • NumPy • Leaflet • D3.js •
Shepherd.js • Shapely • libpysal • scikit-learn • statsmodels •
OpenFEMA • ACS • GitHub Pages
Gallery
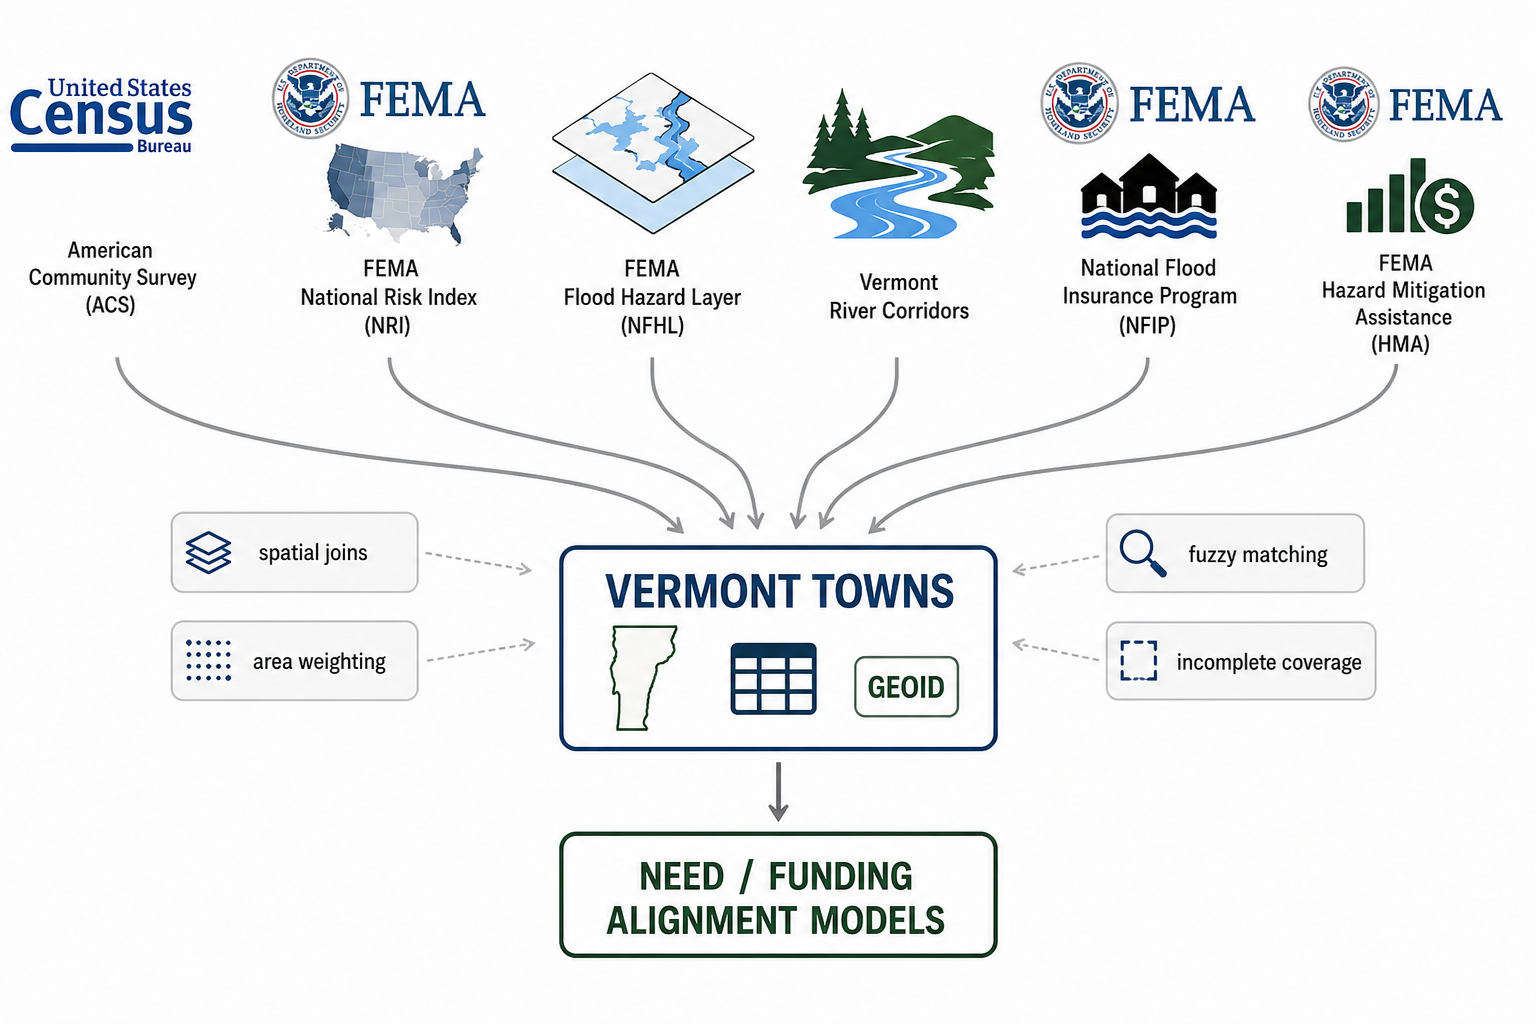 Data sources and analytical workflow used in the study. Federal
hazard, insurance, demographic, and mitigation datasets are
integrated at the municipal level to estimate flood mitigation
need and evaluate how funding aligns with that need. Source:
AI-generated.
Data sources and analytical workflow used in the study. Federal
hazard, insurance, demographic, and mitigation datasets are
integrated at the municipal level to estimate flood mitigation
need and evaluate how funding aligns with that need. Source:
AI-generated.
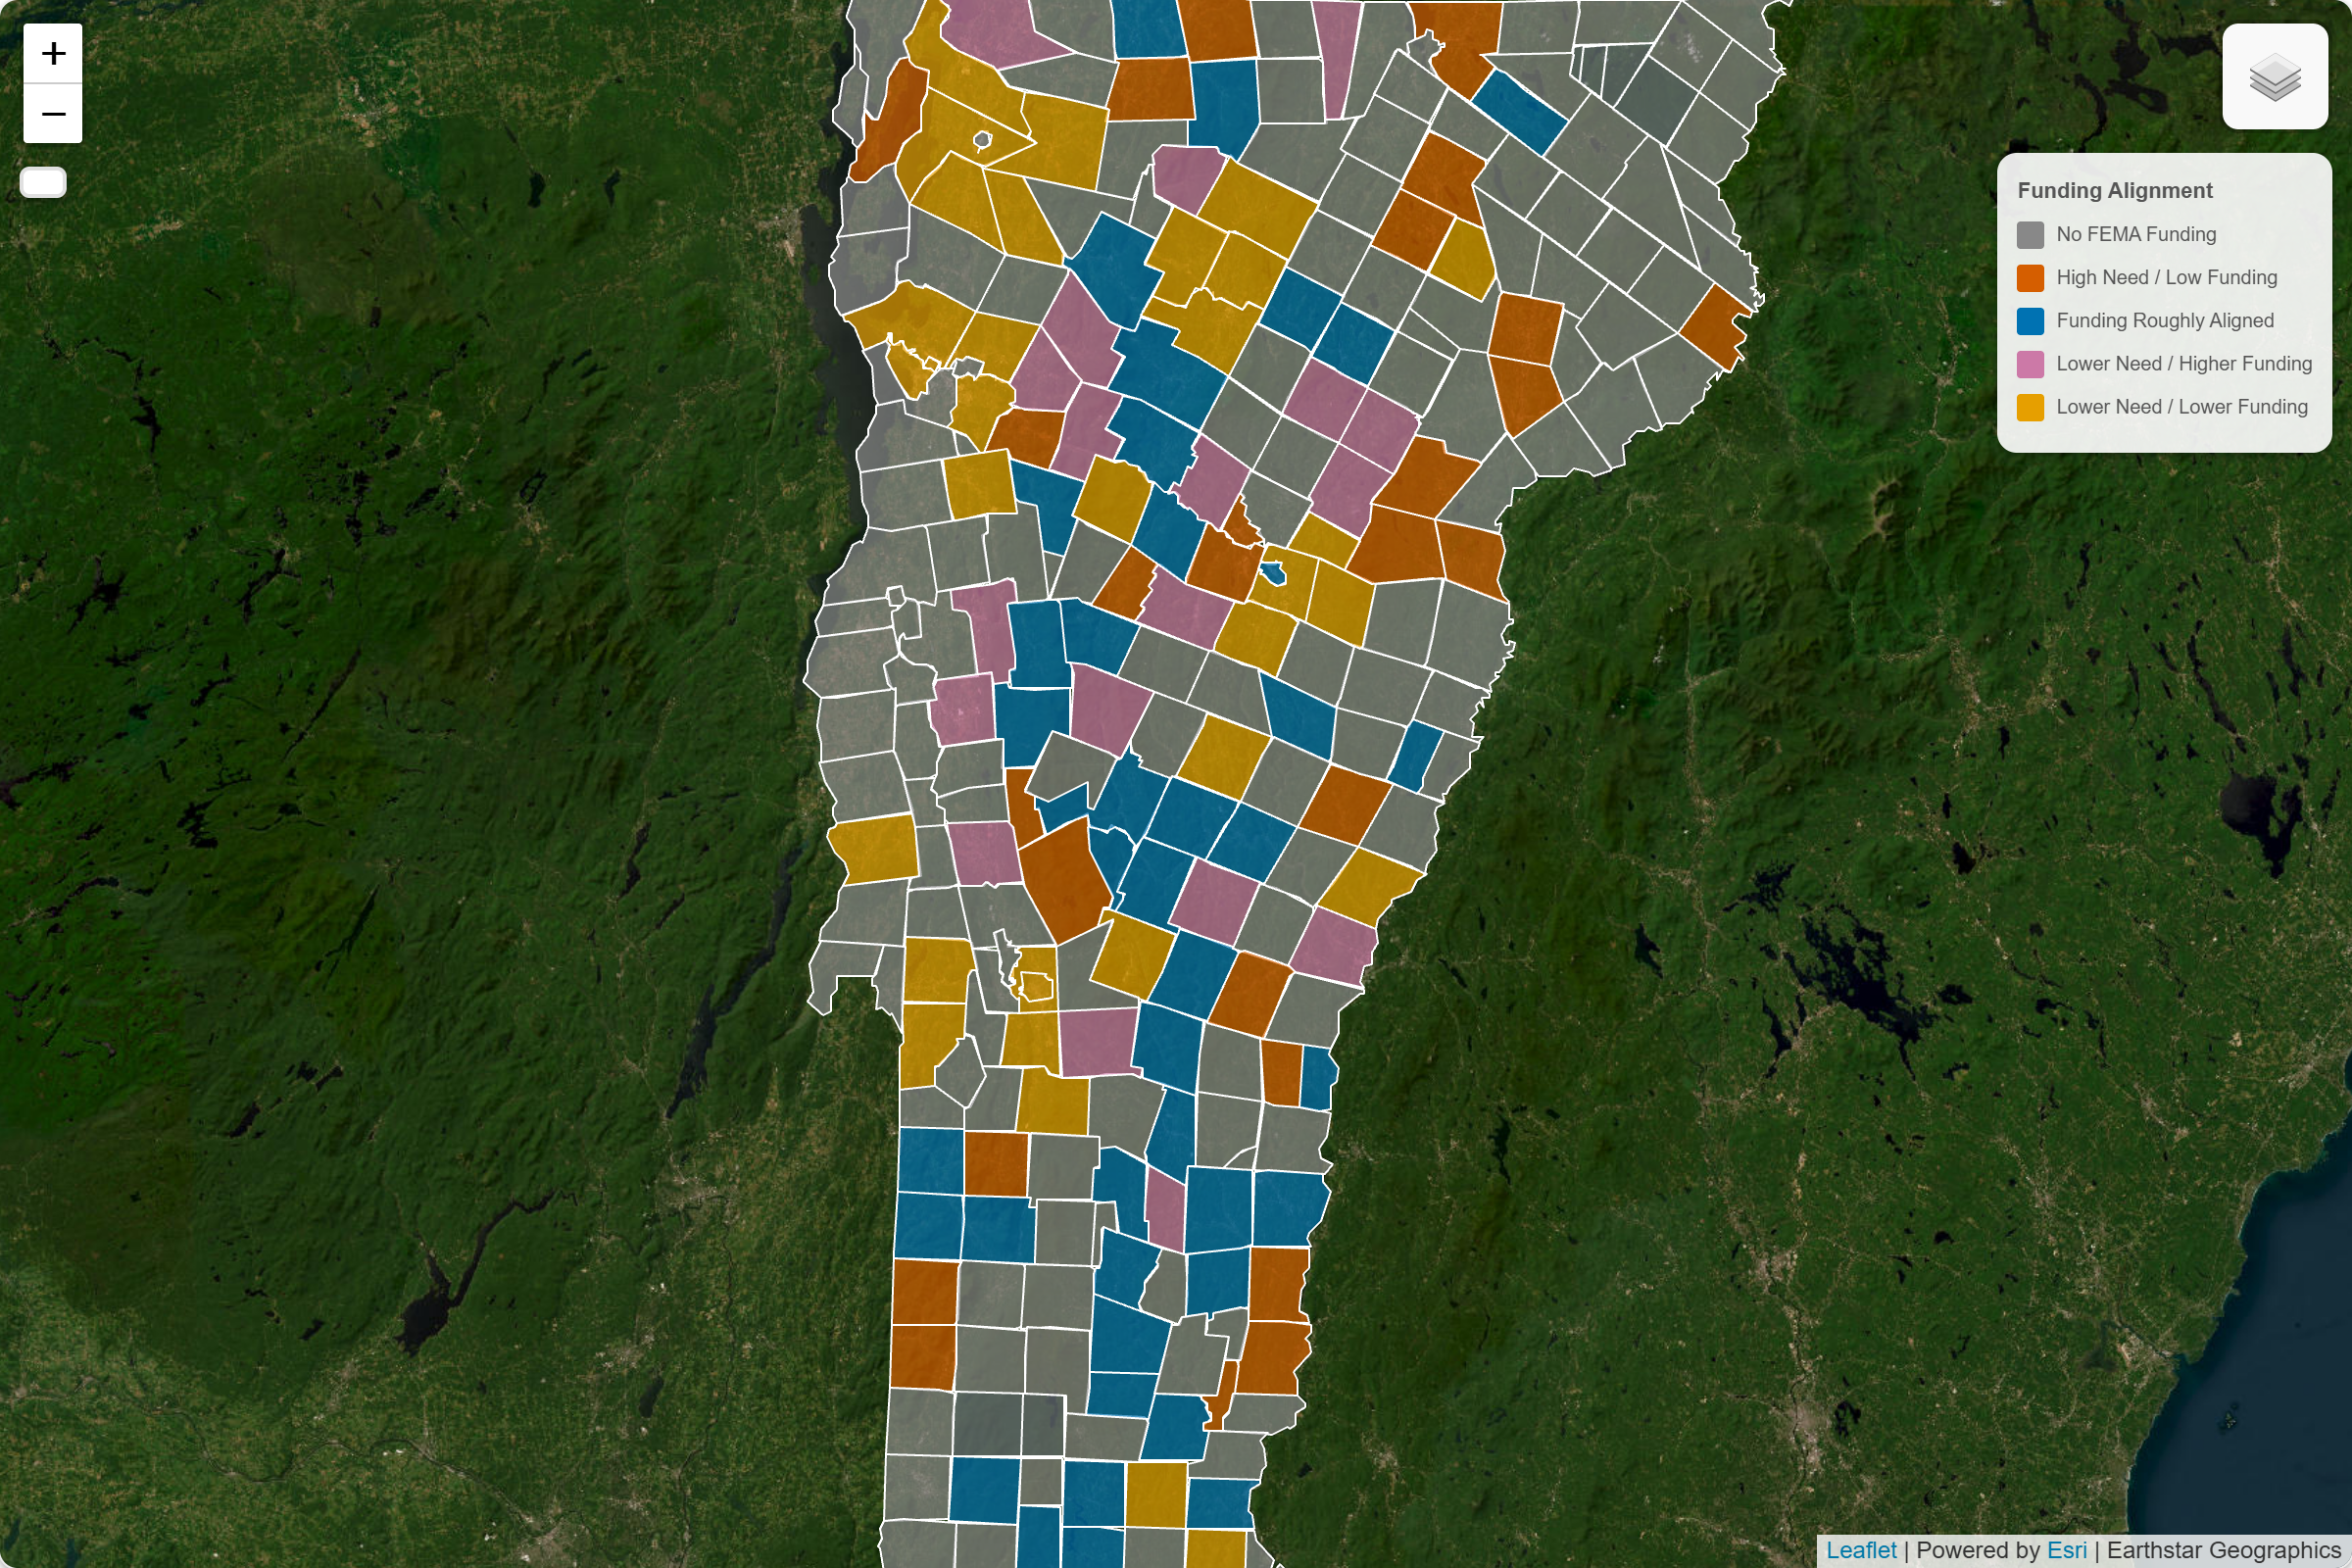 Vermont towns classified by relative need and FEMA mitigation
funding. The map highlights communities that appear high need with
limited investment, historically invested, aligned, or entirely
absent from the funding record.
Vermont towns classified by relative need and FEMA mitigation
funding. The map highlights communities that appear high need with
limited investment, historically invested, aligned, or entirely
absent from the funding record.
 Relationship between modeled need and FEMA mitigation funding.
The broad scatter and weak trend suggest limited alignment between
structural need and funding allocation; points shift as the risk
model changes.
Relationship between modeled need and FEMA mitigation funding.
The broad scatter and weak trend suggest limited alignment between
structural need and funding allocation; points shift as the risk
model changes.
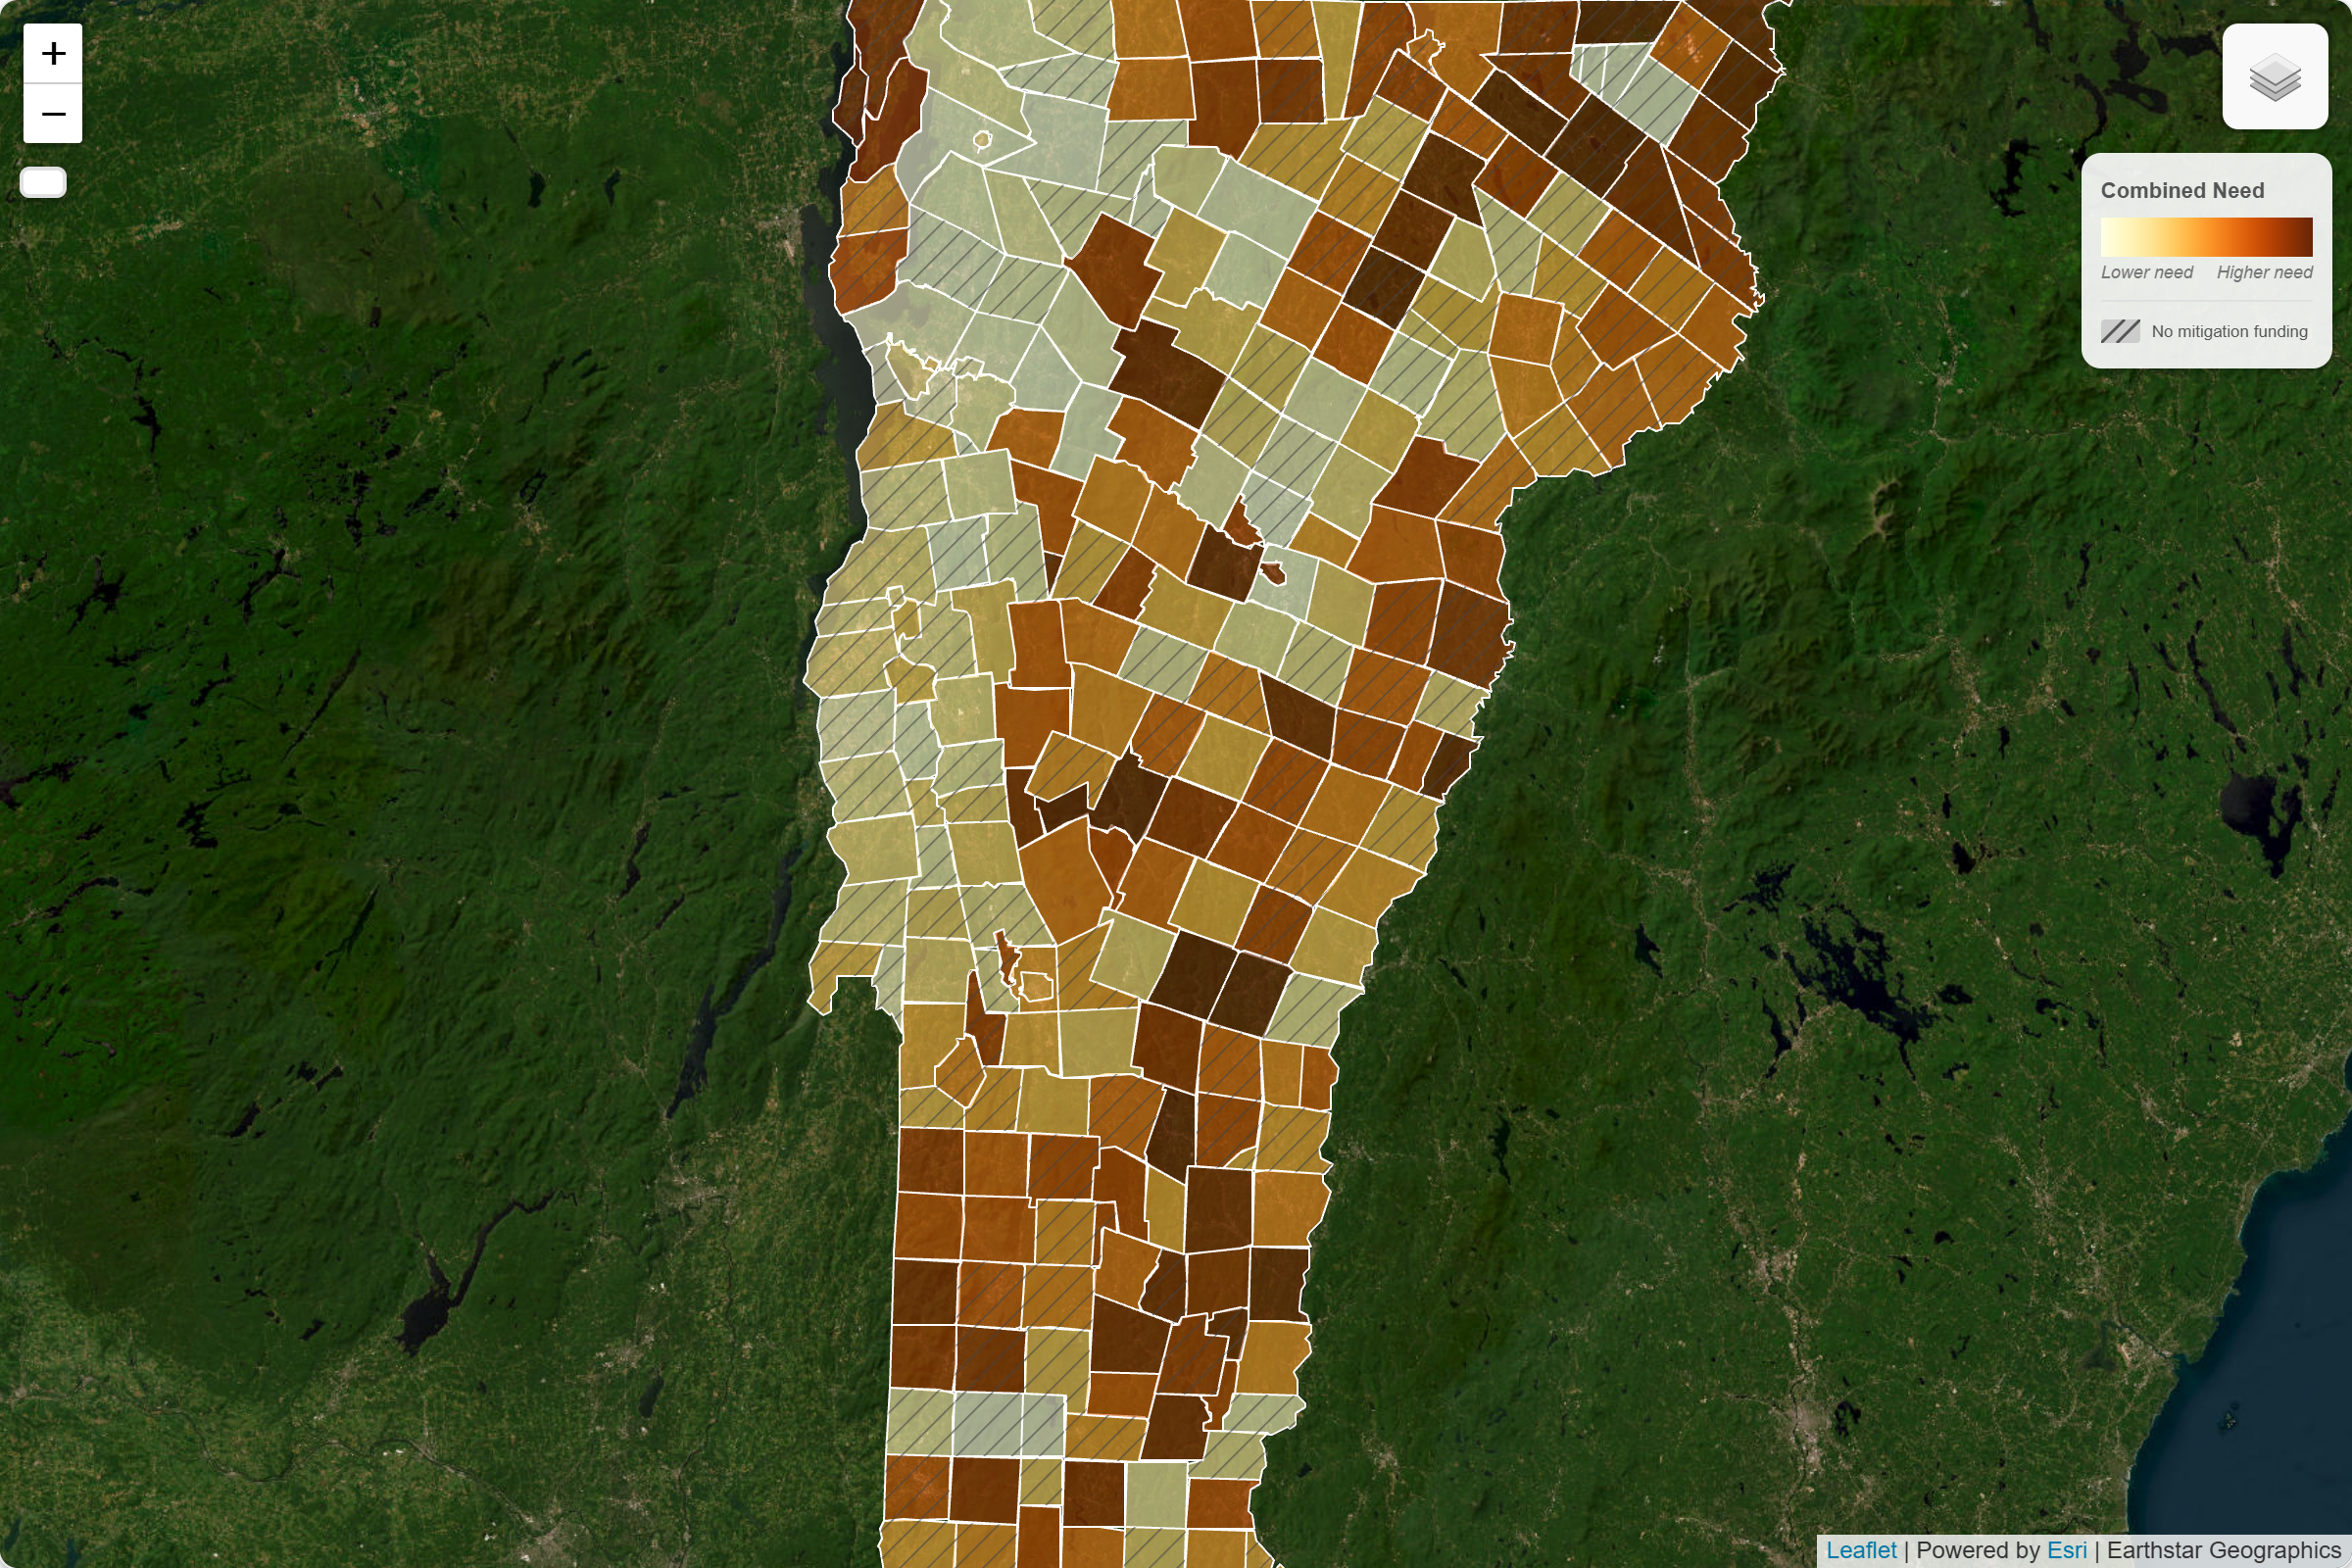 Composite measure of flood exposure and social vulnerability.
Higher-ranked communities face greater modeled need for flood
mitigation investment relative to their peers.
Composite measure of flood exposure and social vulnerability.
Higher-ranked communities face greater modeled need for flood
mitigation investment relative to their peers.
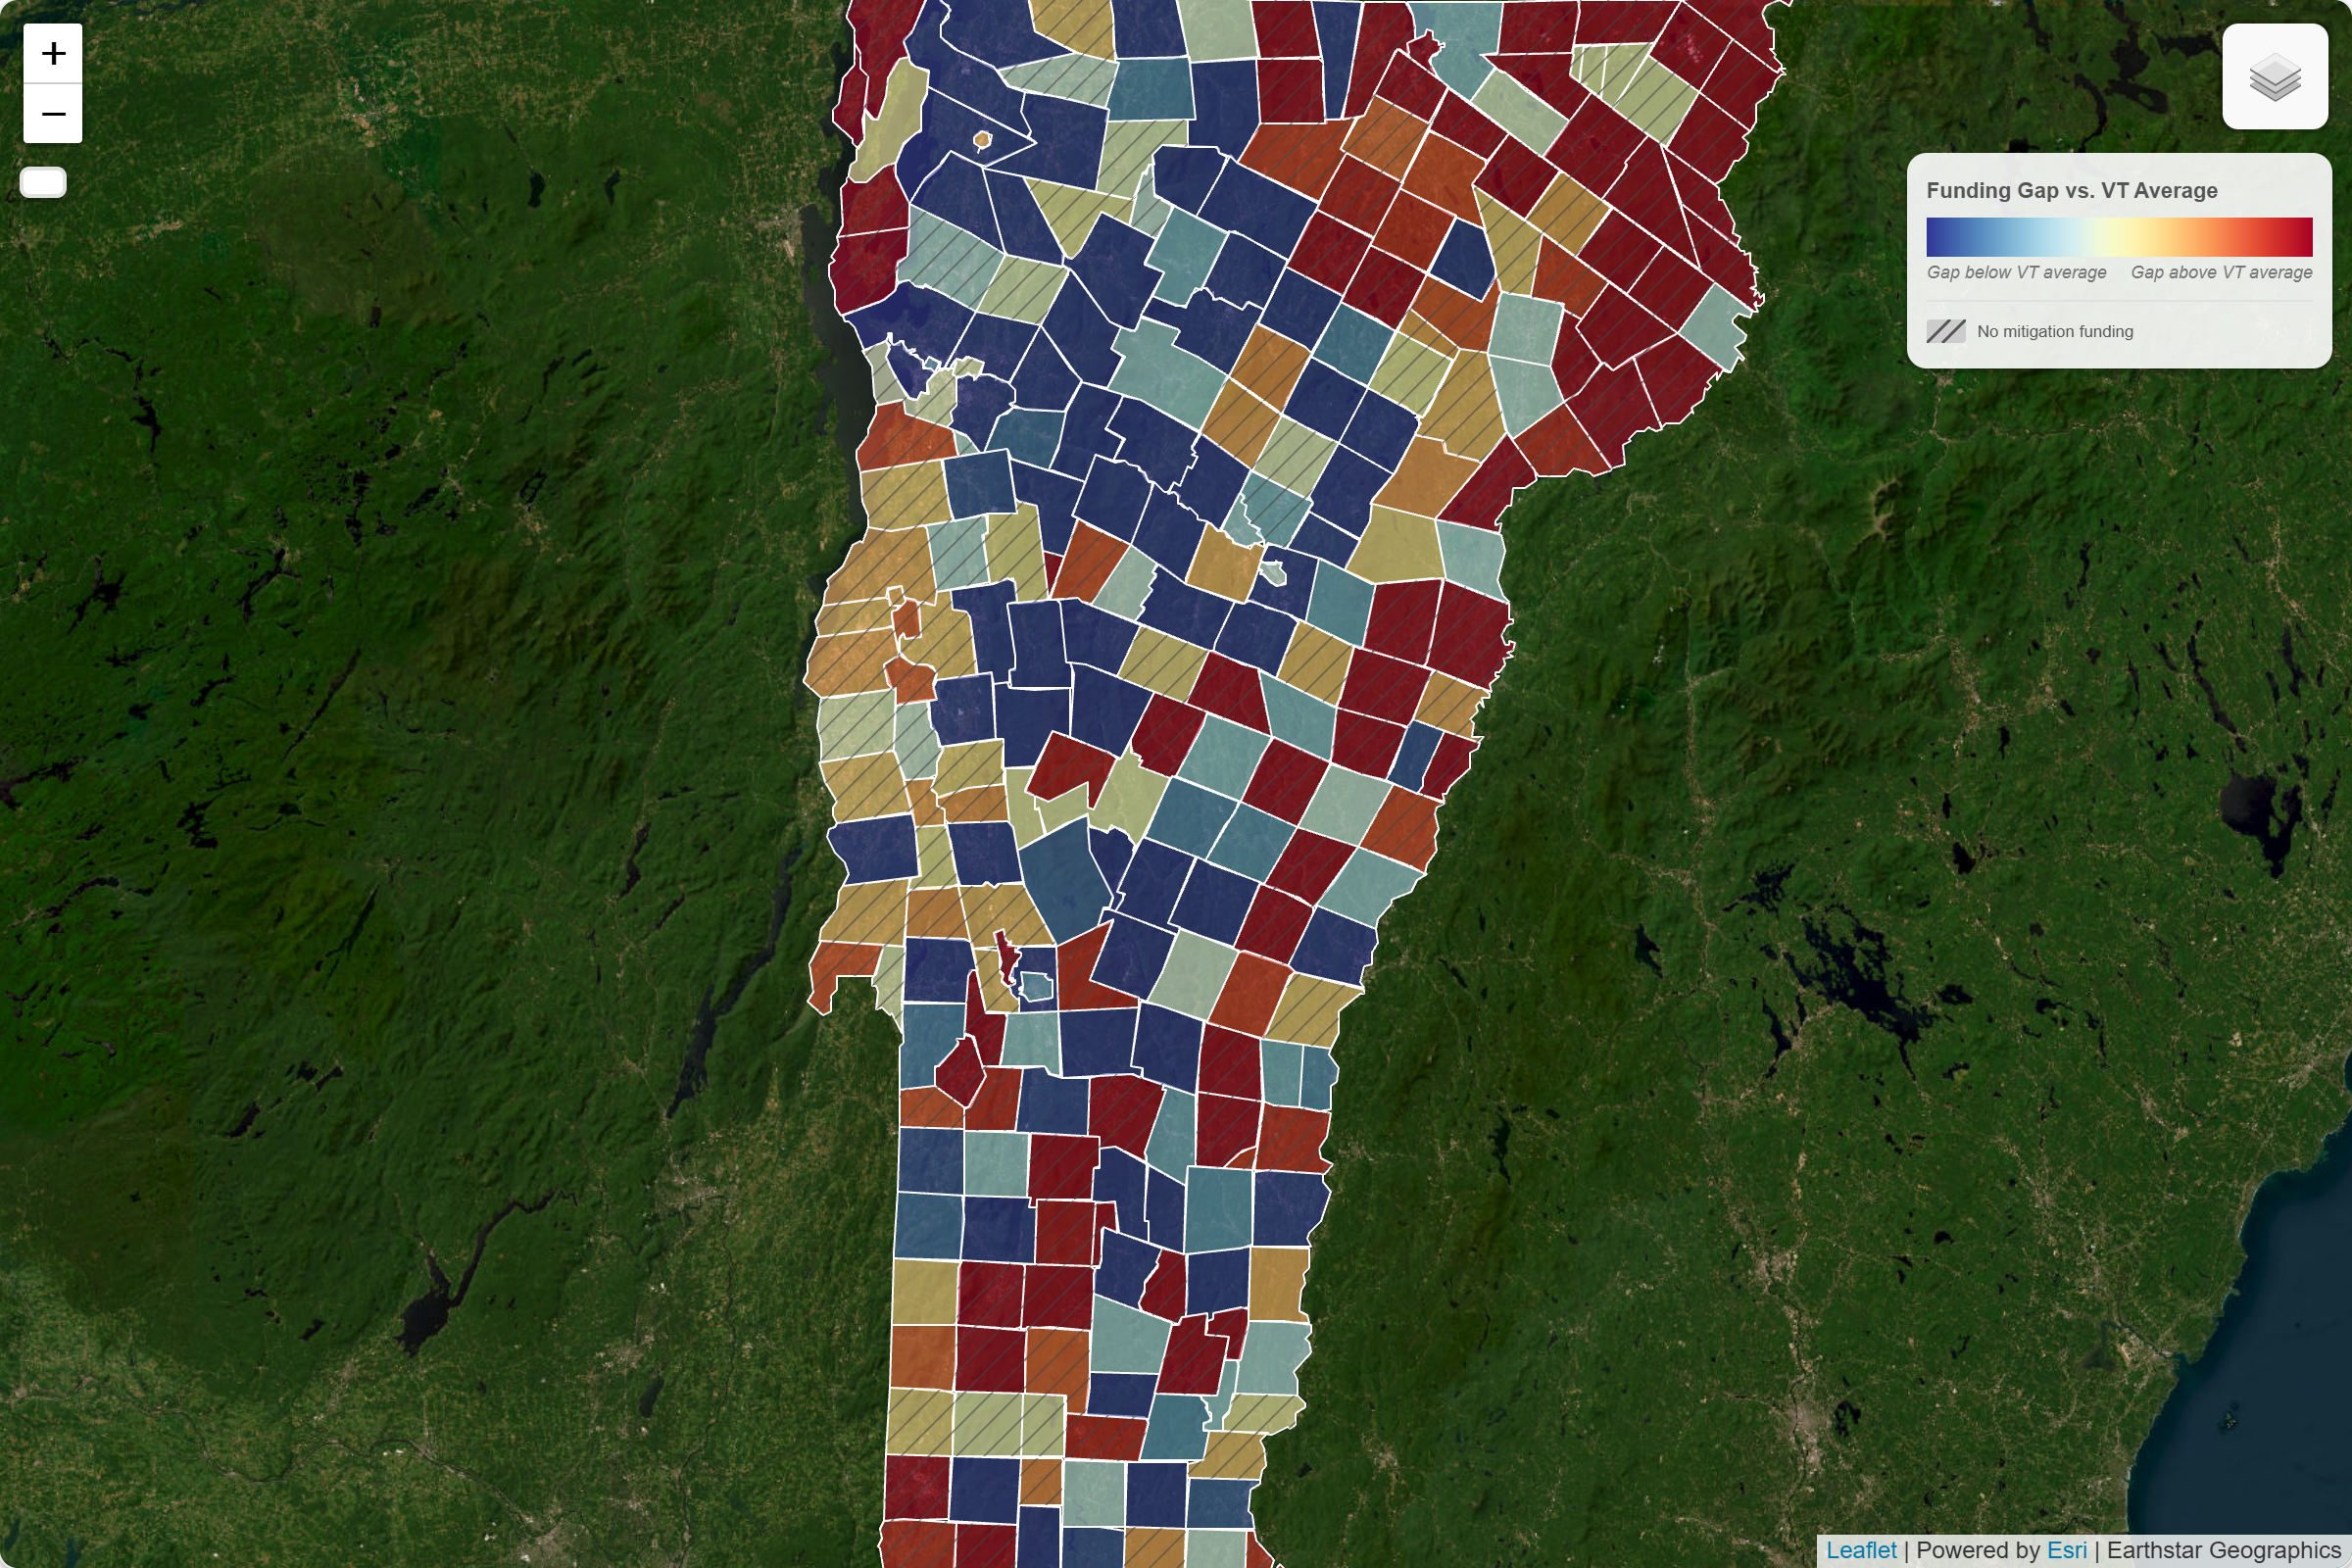 Difference between modeled need and received funding. Red towns
indicate communities where need exceeds investment compared to the
statewide average.
Difference between modeled need and received funding. Red towns
indicate communities where need exceeds investment compared to the
statewide average.
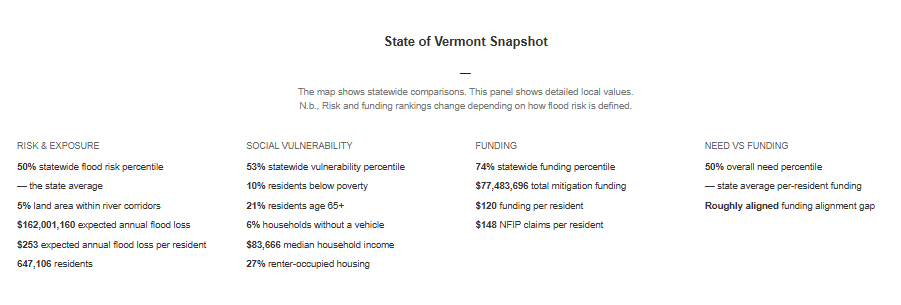 Drill-down view for individual municipalities, including funding,
risk, vulnerability, rankings, and quadrant classification.
Drill-down view for individual municipalities, including funding,
risk, vulnerability, rankings, and quadrant classification.
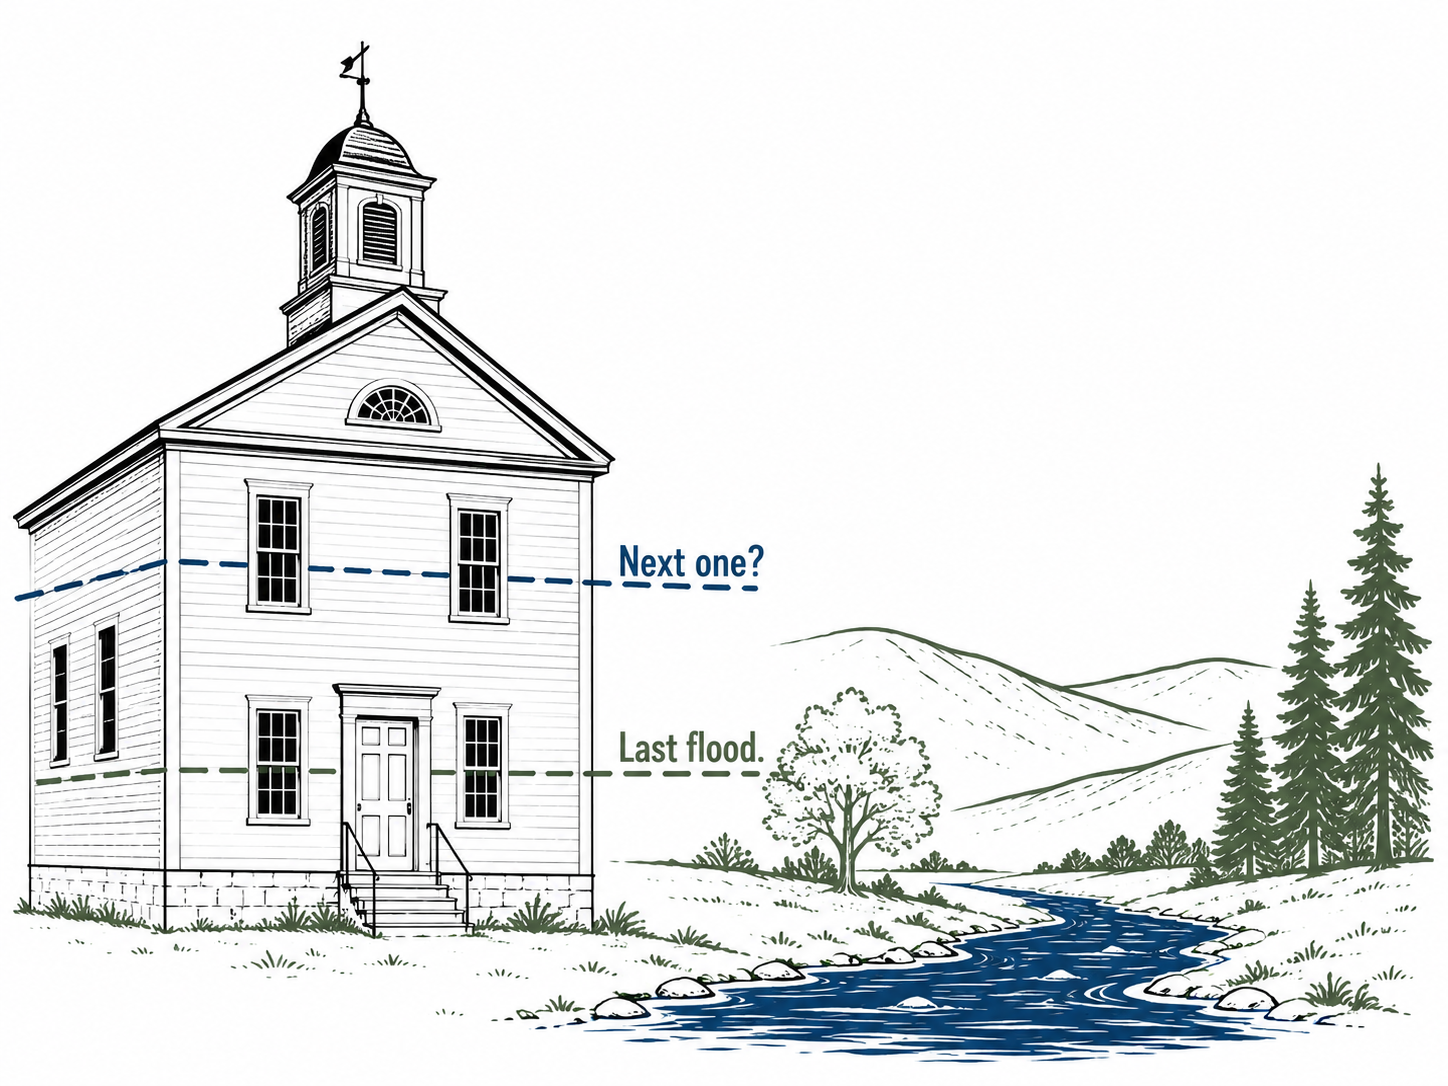 A visual metaphor for the central question explored in
Floodlines: when institutions measure risk through past disasters,
future floods may arrive above the last high-water mark. Simple,
interpretable models can serve as an early-warning tool for
decision-makers. Illustration: AI-generated.
A visual metaphor for the central question explored in
Floodlines: when institutions measure risk through past disasters,
future floods may arrive above the last high-water mark. Simple,
interpretable models can serve as an early-warning tool for
decision-makers. Illustration: AI-generated.
References
- U.S. Census TIGER/Line 2025: Vermont County Subdivisions — Vermont town (county subdivision) boundaries.
- U.S. Census TIGER/Line 2025: Vermont Areawater (Chittenden County) — Water bodies (for masking Lake Champlain).
- FEMA National Flood Hazard Layer (NFHL) — FEMA flood zone boundaries.
- Vermont ANR River Corridors — River corridor and flood-prone area delineation.
- U.S. Census: American Community Survey (ACS) — Town-level demographic and socioeconomic data.
- OpenFEMA: Hazard Mitigation Assistance Projects — FEMA mitigation funding and project allocations.
- FEMA Mitigation eGrants Guide — Project activity classification and codes.
- FRED: CPI-U (U.S. City Average) — CPI series for inflation-adjusting funding values.
- OpenFEMA: NFIP Redacted Claims — Town-level flood insurance claims data.
- OpenFEMA: NFIP Redacted Policies — Policy counts and penetration by town.
- UnitedStatesZipCodes.org ZIP Code Database — ZIP-to-town crosswalk for missing community names.
- FEMA National Risk Index (NRI) — Expected annual loss and vulnerability benchmarks.